Your entire RGM stack.
One platform.
Tailored for your business.
Stop losing weeks to disconnected spreadsheets and dashboards nobody trusts. RGM Noah gives your commercial leadership a single source of truth — so you can make faster decisions and protect your margins.
Designed by Revenue Growth Managers for Revenue Growth Managers
Your team is spending more time building reports than reading them
Pricing decisions are delayed because the data lives in three different places. Trade spend reviews take a week to prepare. Your GM asks a simple share question and it takes two days to answer. When every team runs their own numbers, nobody is aligned — and margin leaks go unnoticed.
Stop flying blind
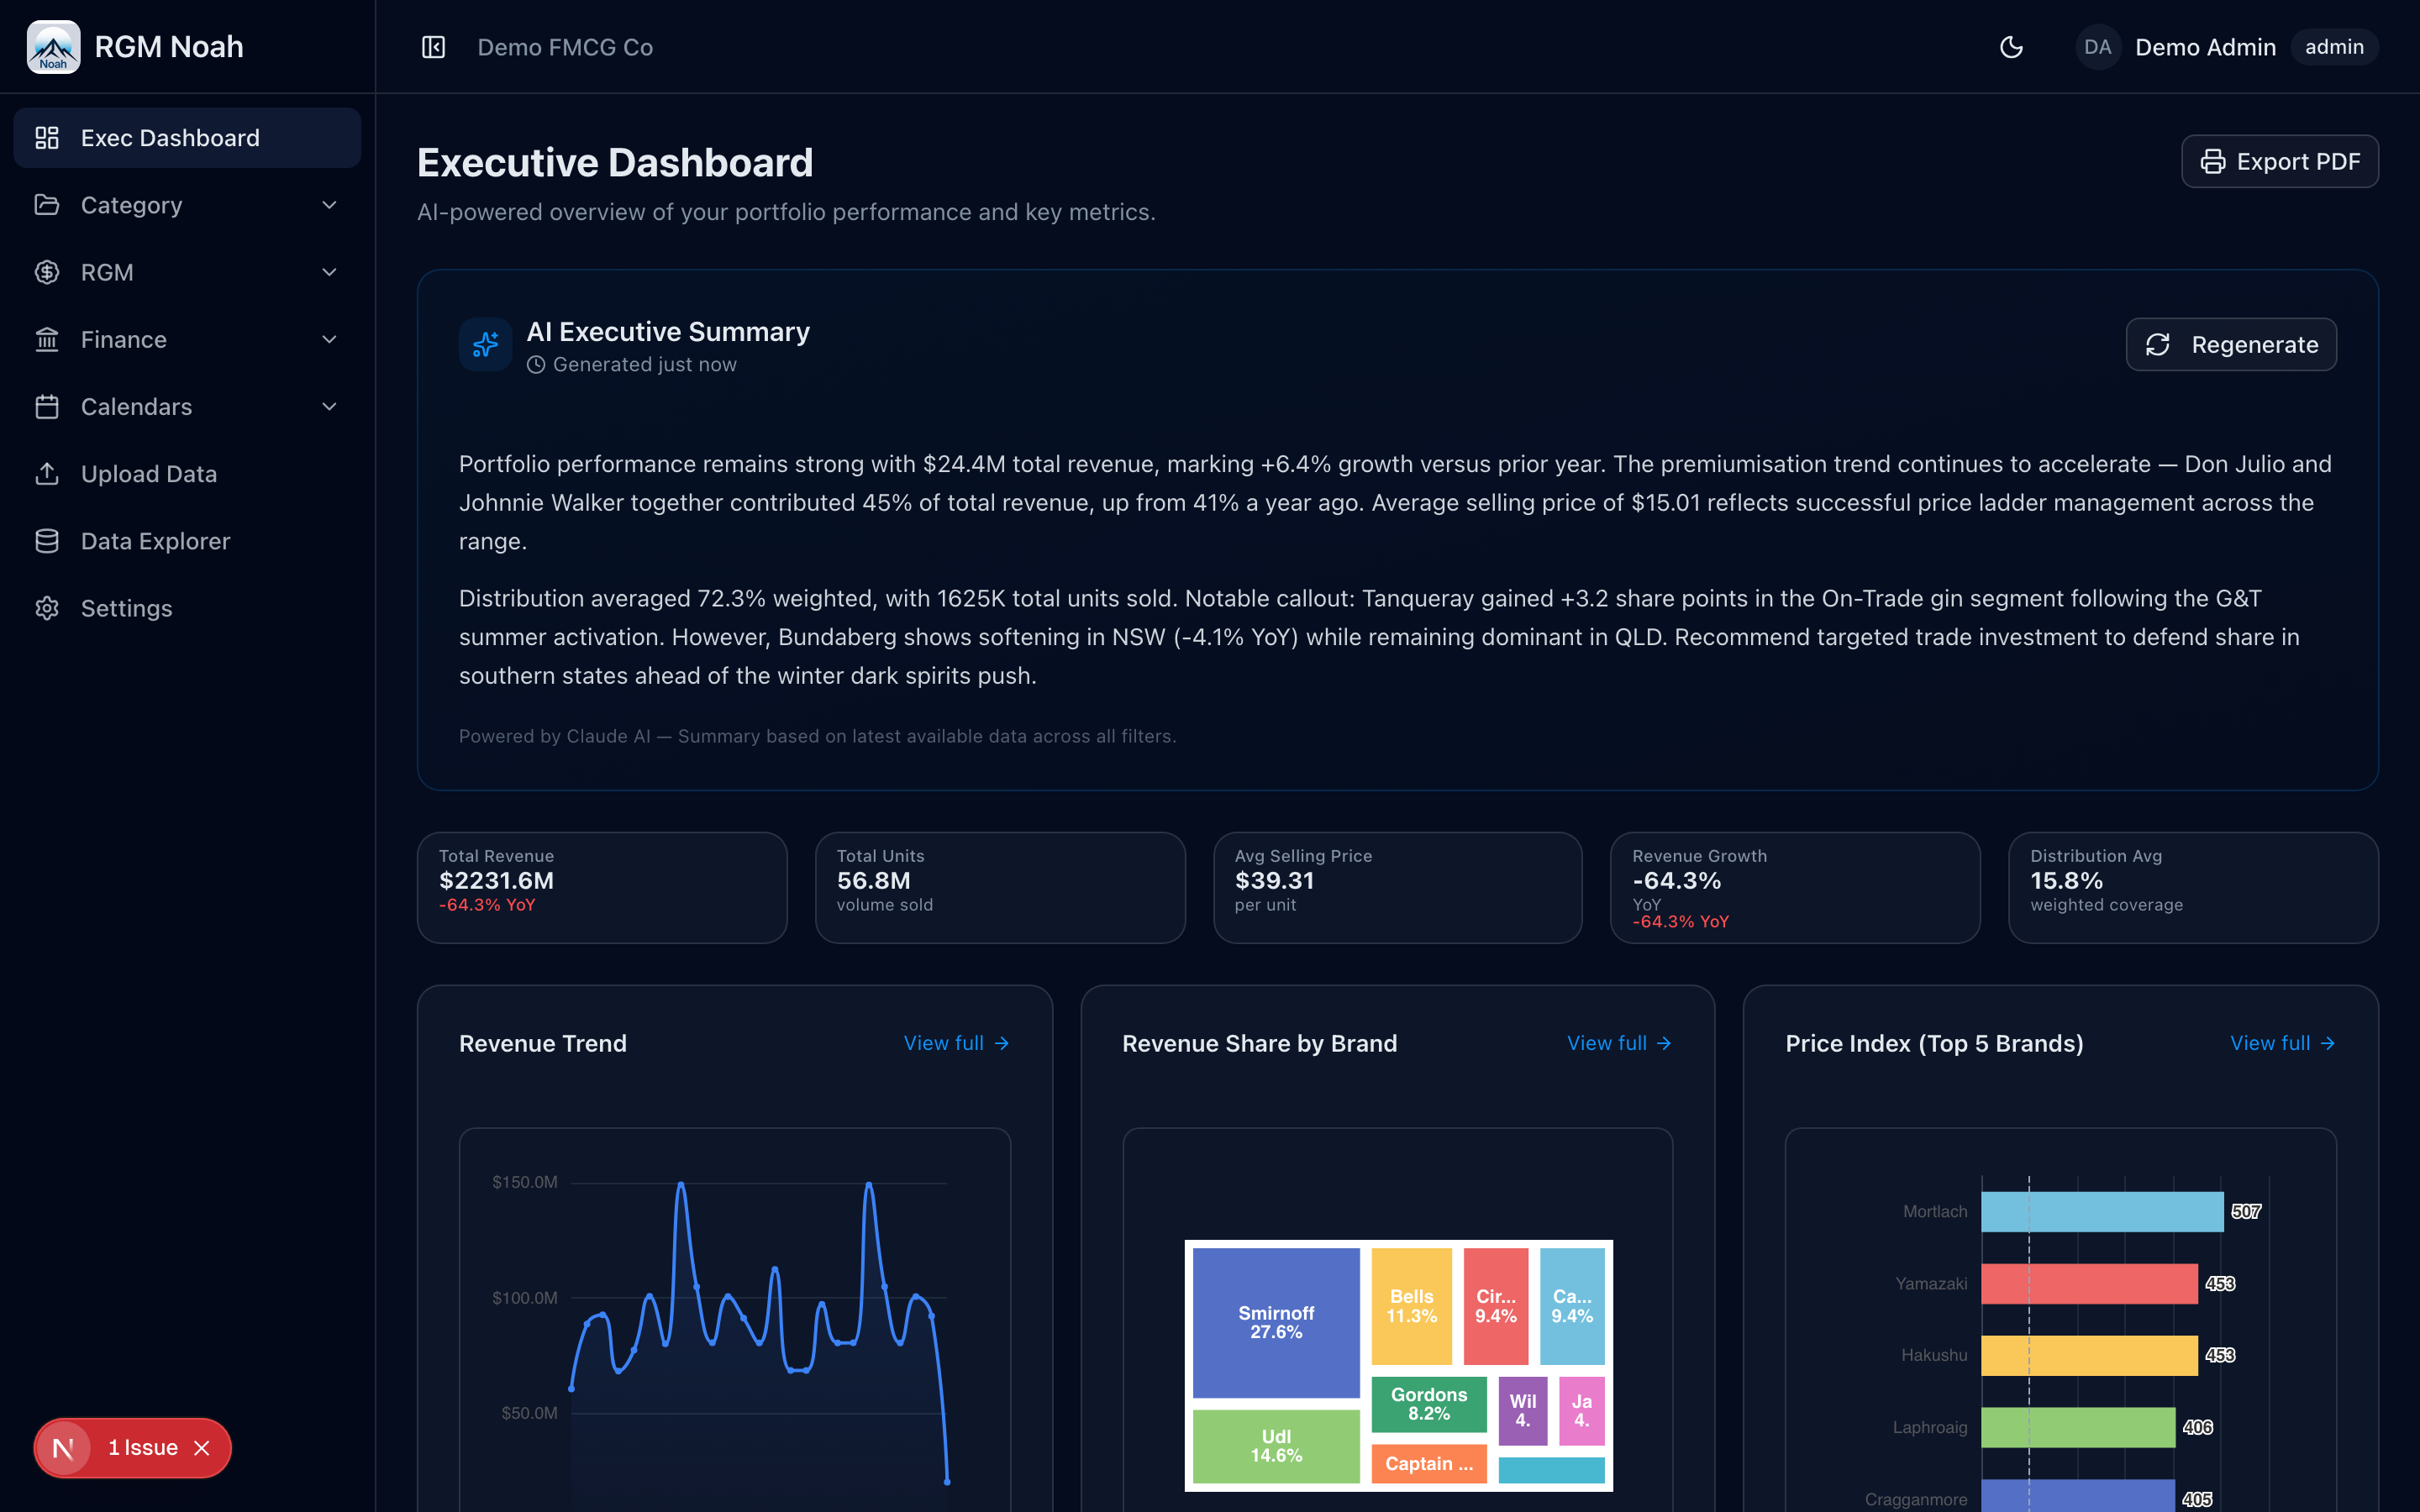
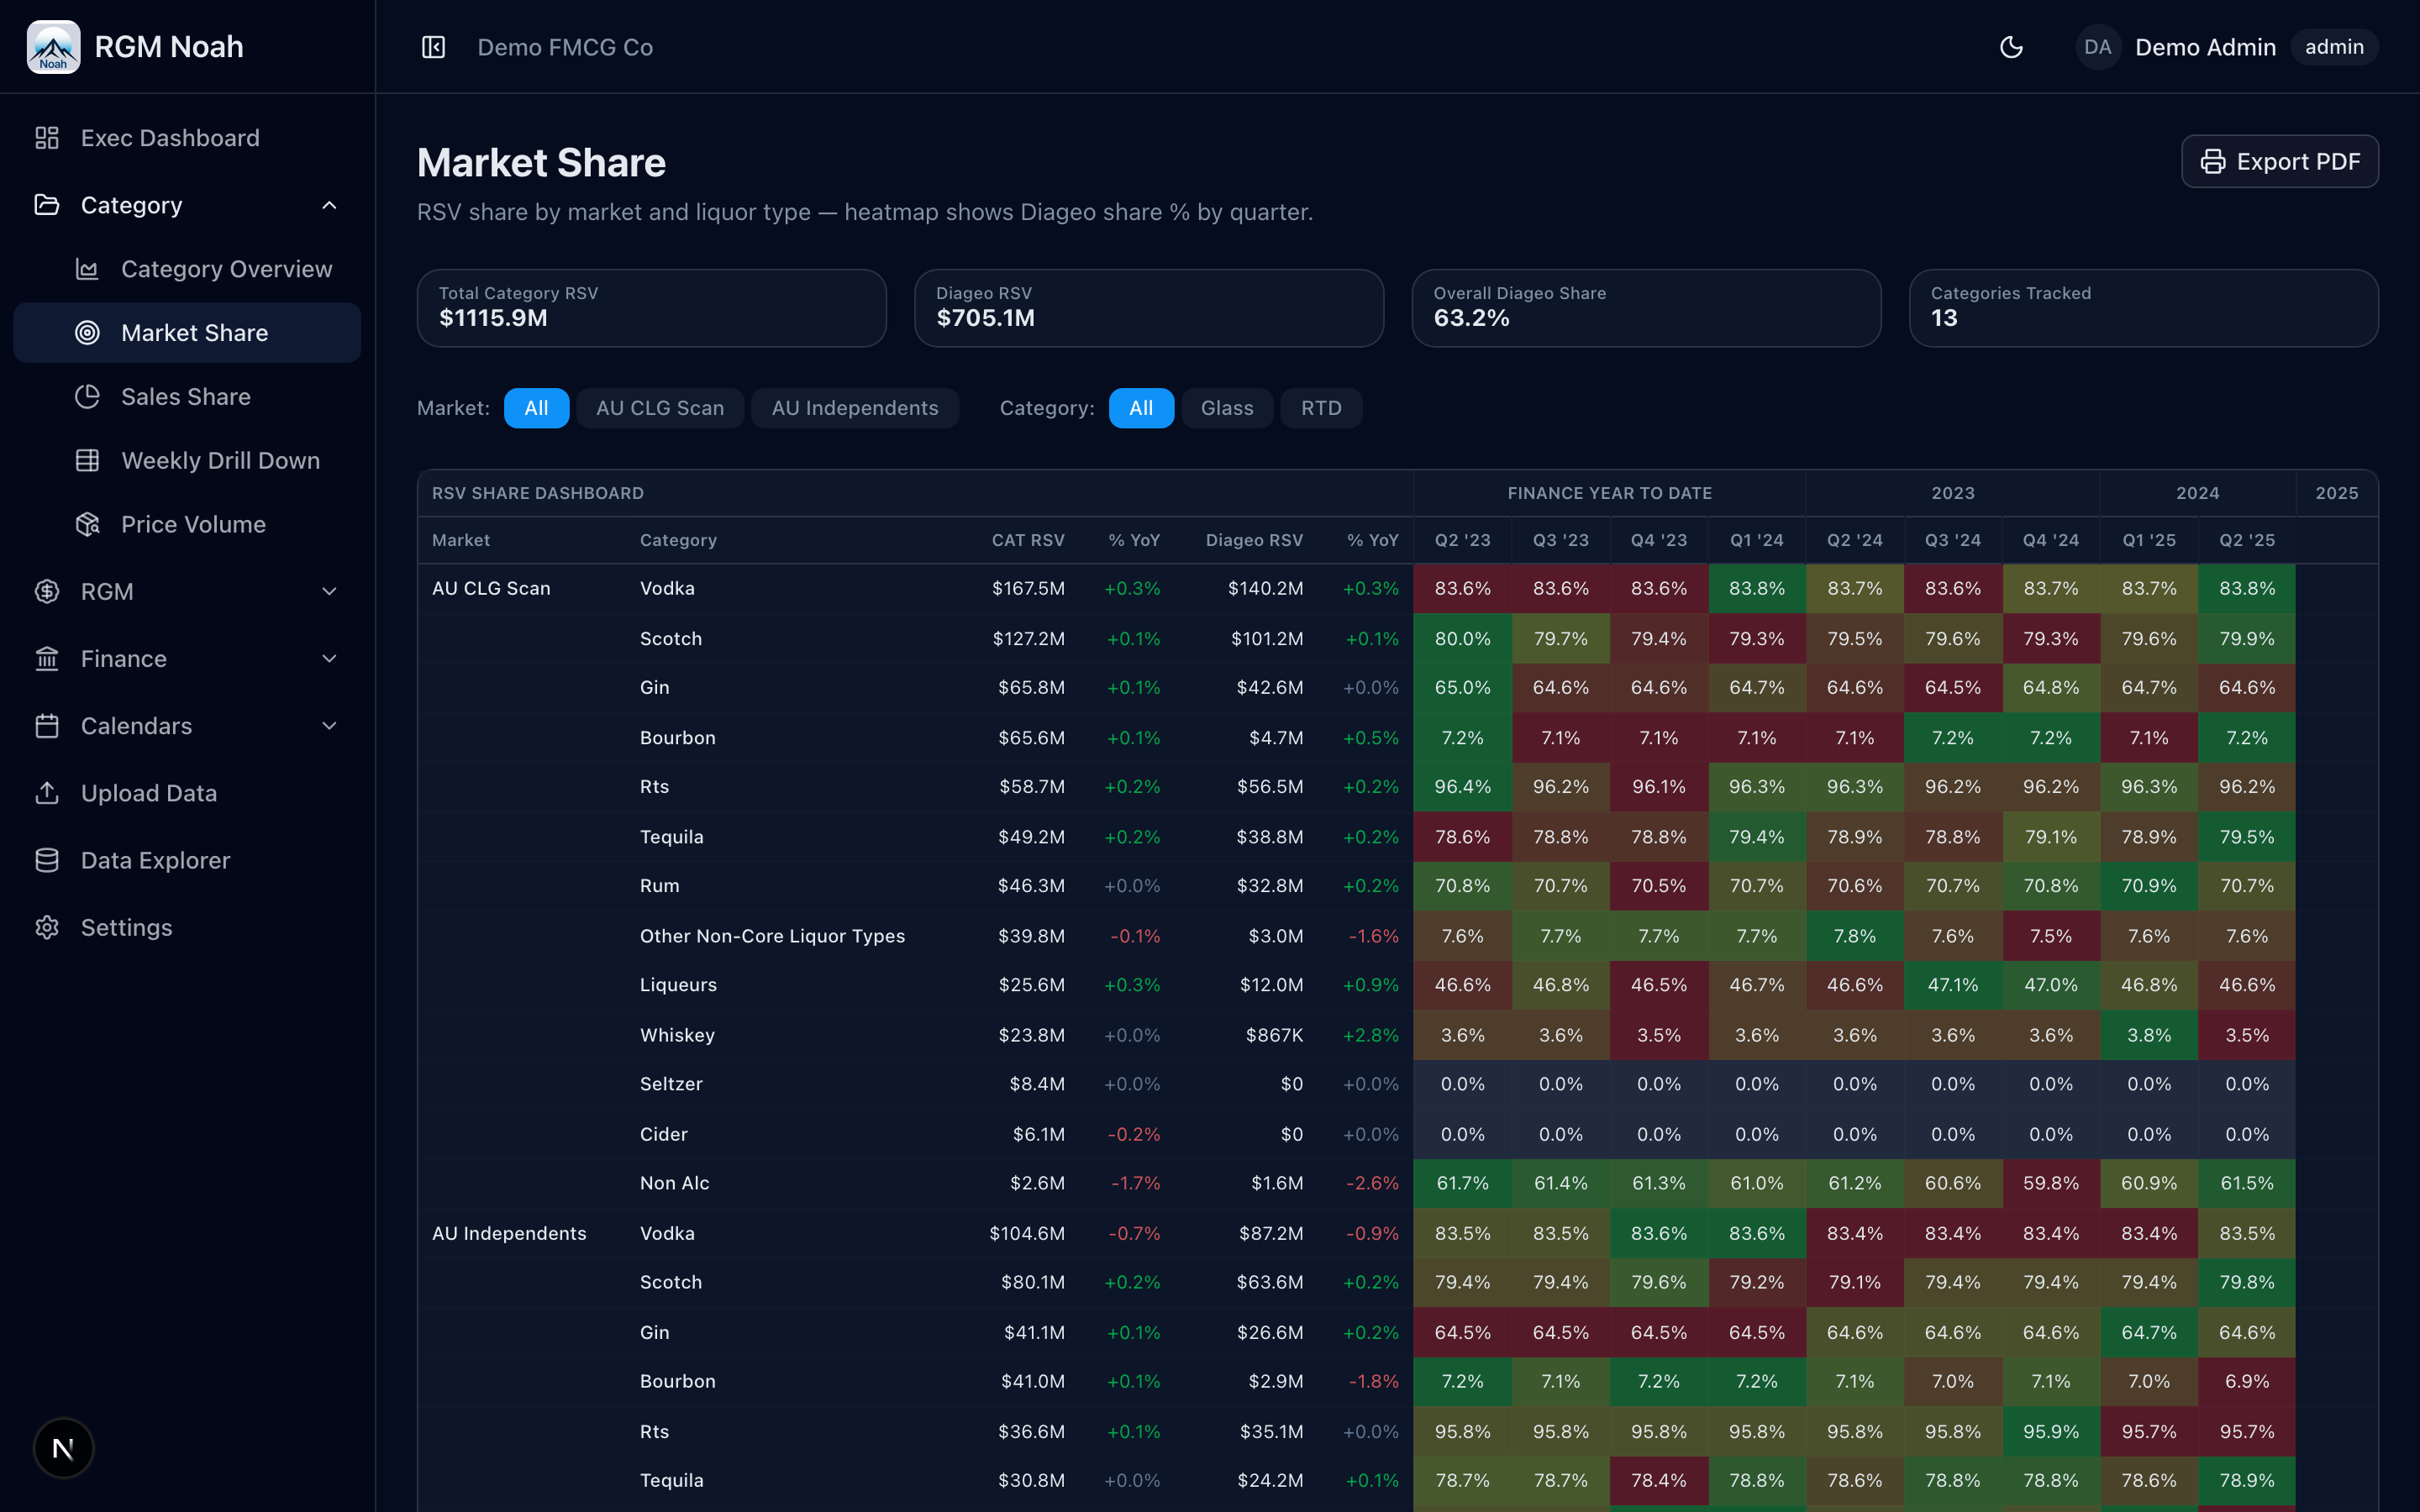
Know exactly where you're winning — and where you're leaking
Your GM shouldn't have to wait two days for a share update. With revenue, volume, and market share in one view — broken down by category, brand, or SKU — your leadership team can spot problems in seconds, not weeks.
- Answer share and performance questions instantly
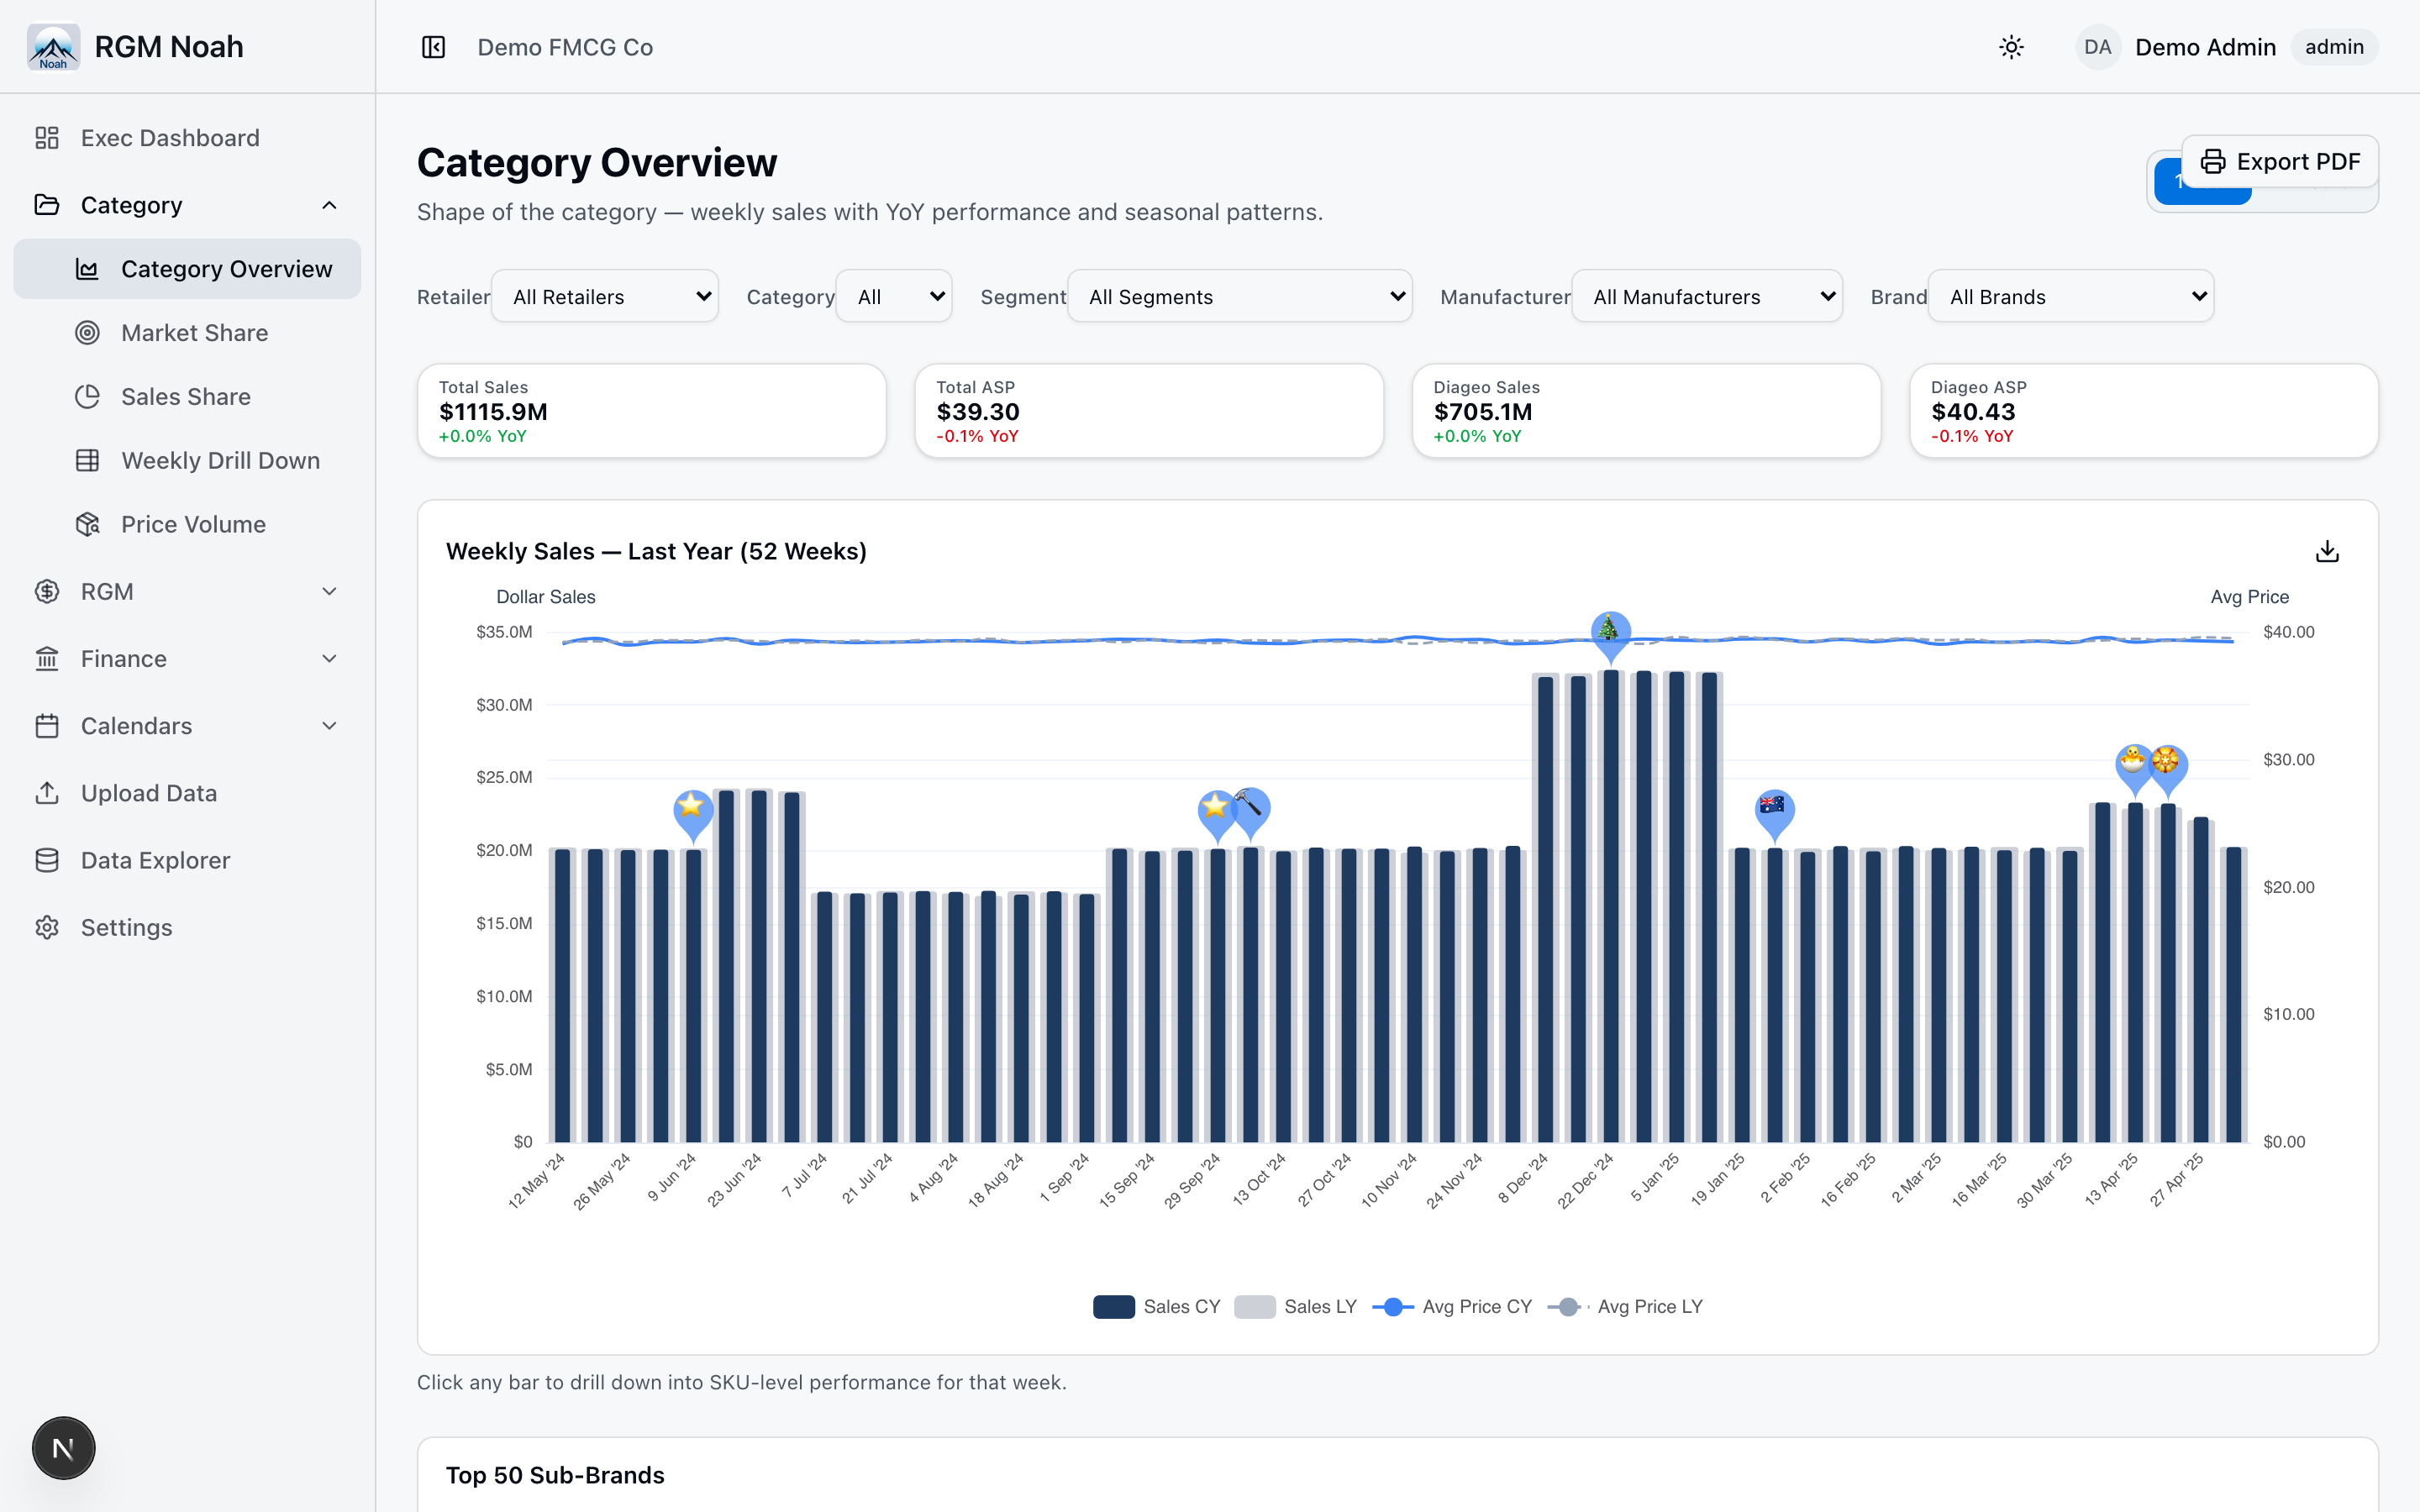
- See which SKUs are dragging and which are driving growth
- Compare CY vs LY without waiting for someone to build a deck
Protect your margins
Stop leaving money on the table with every pricing decision
Most teams don't realise they're over-investing in promos that don't pay back, or that their price architecture has gaps the competition is filling. RGM Noah shows you exactly where margin is being won and lost — volume, price, mix, and cost — so you can act before it's too late.
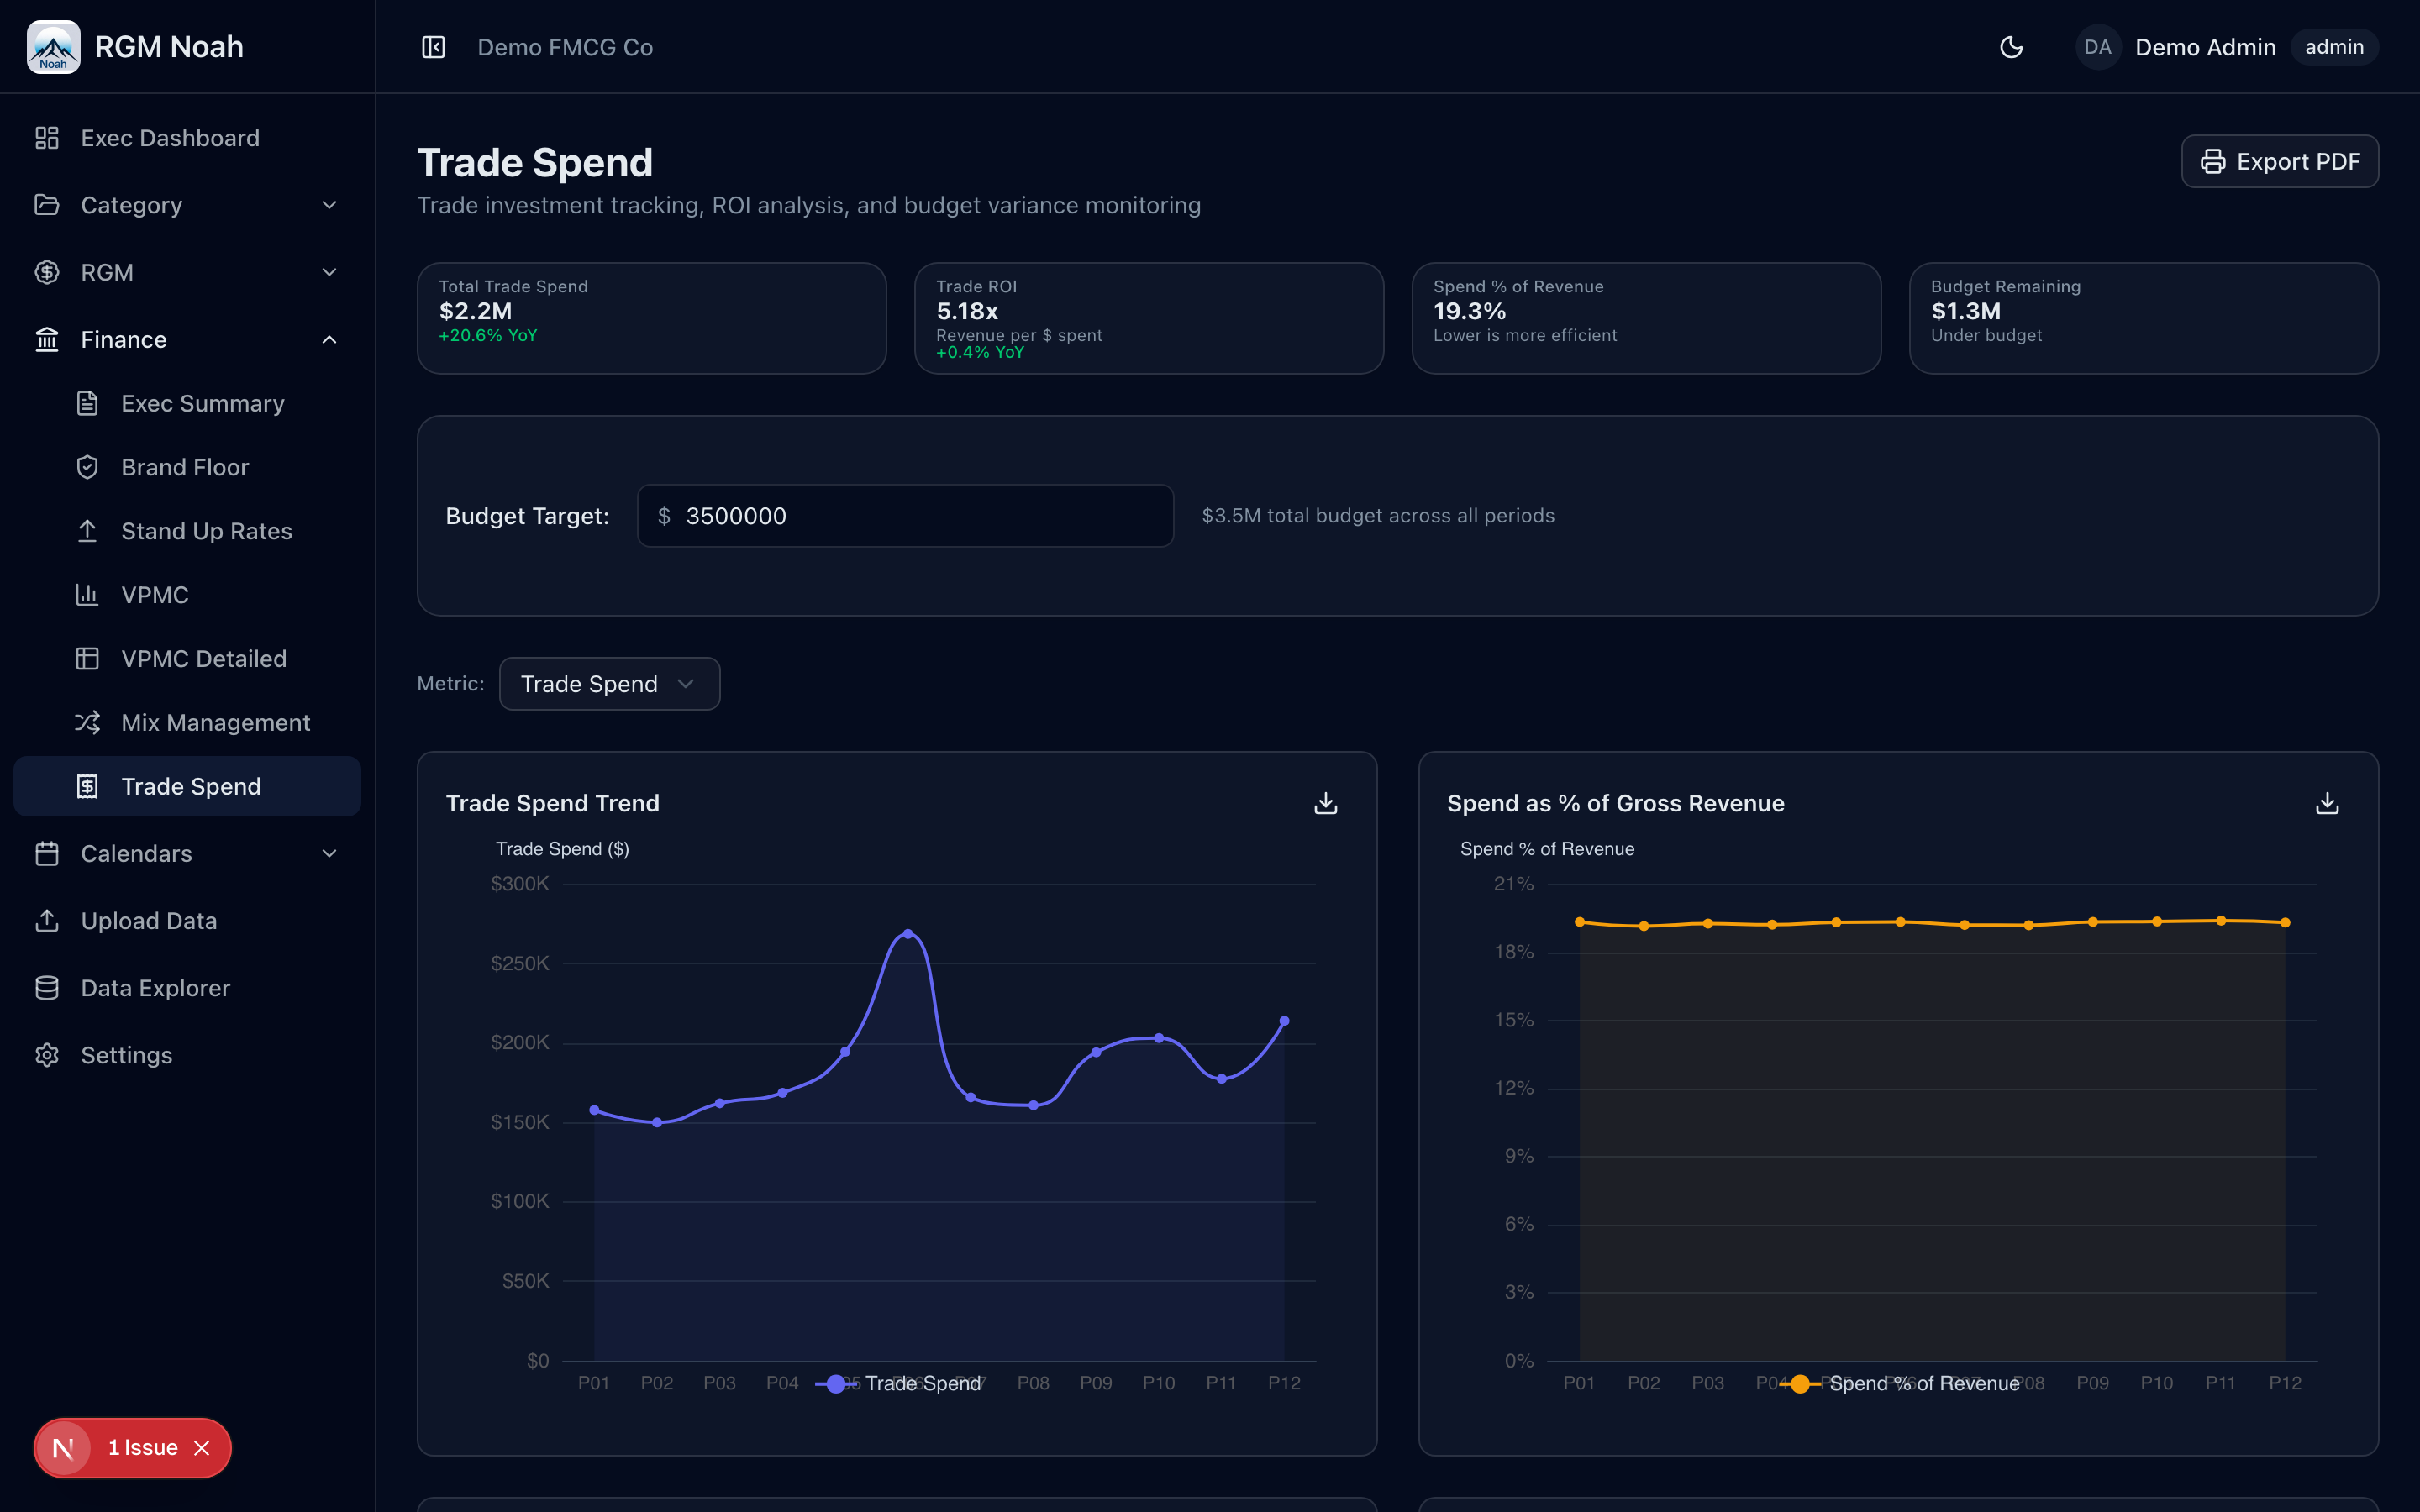
- See which promos actually deliver ROI and which don't
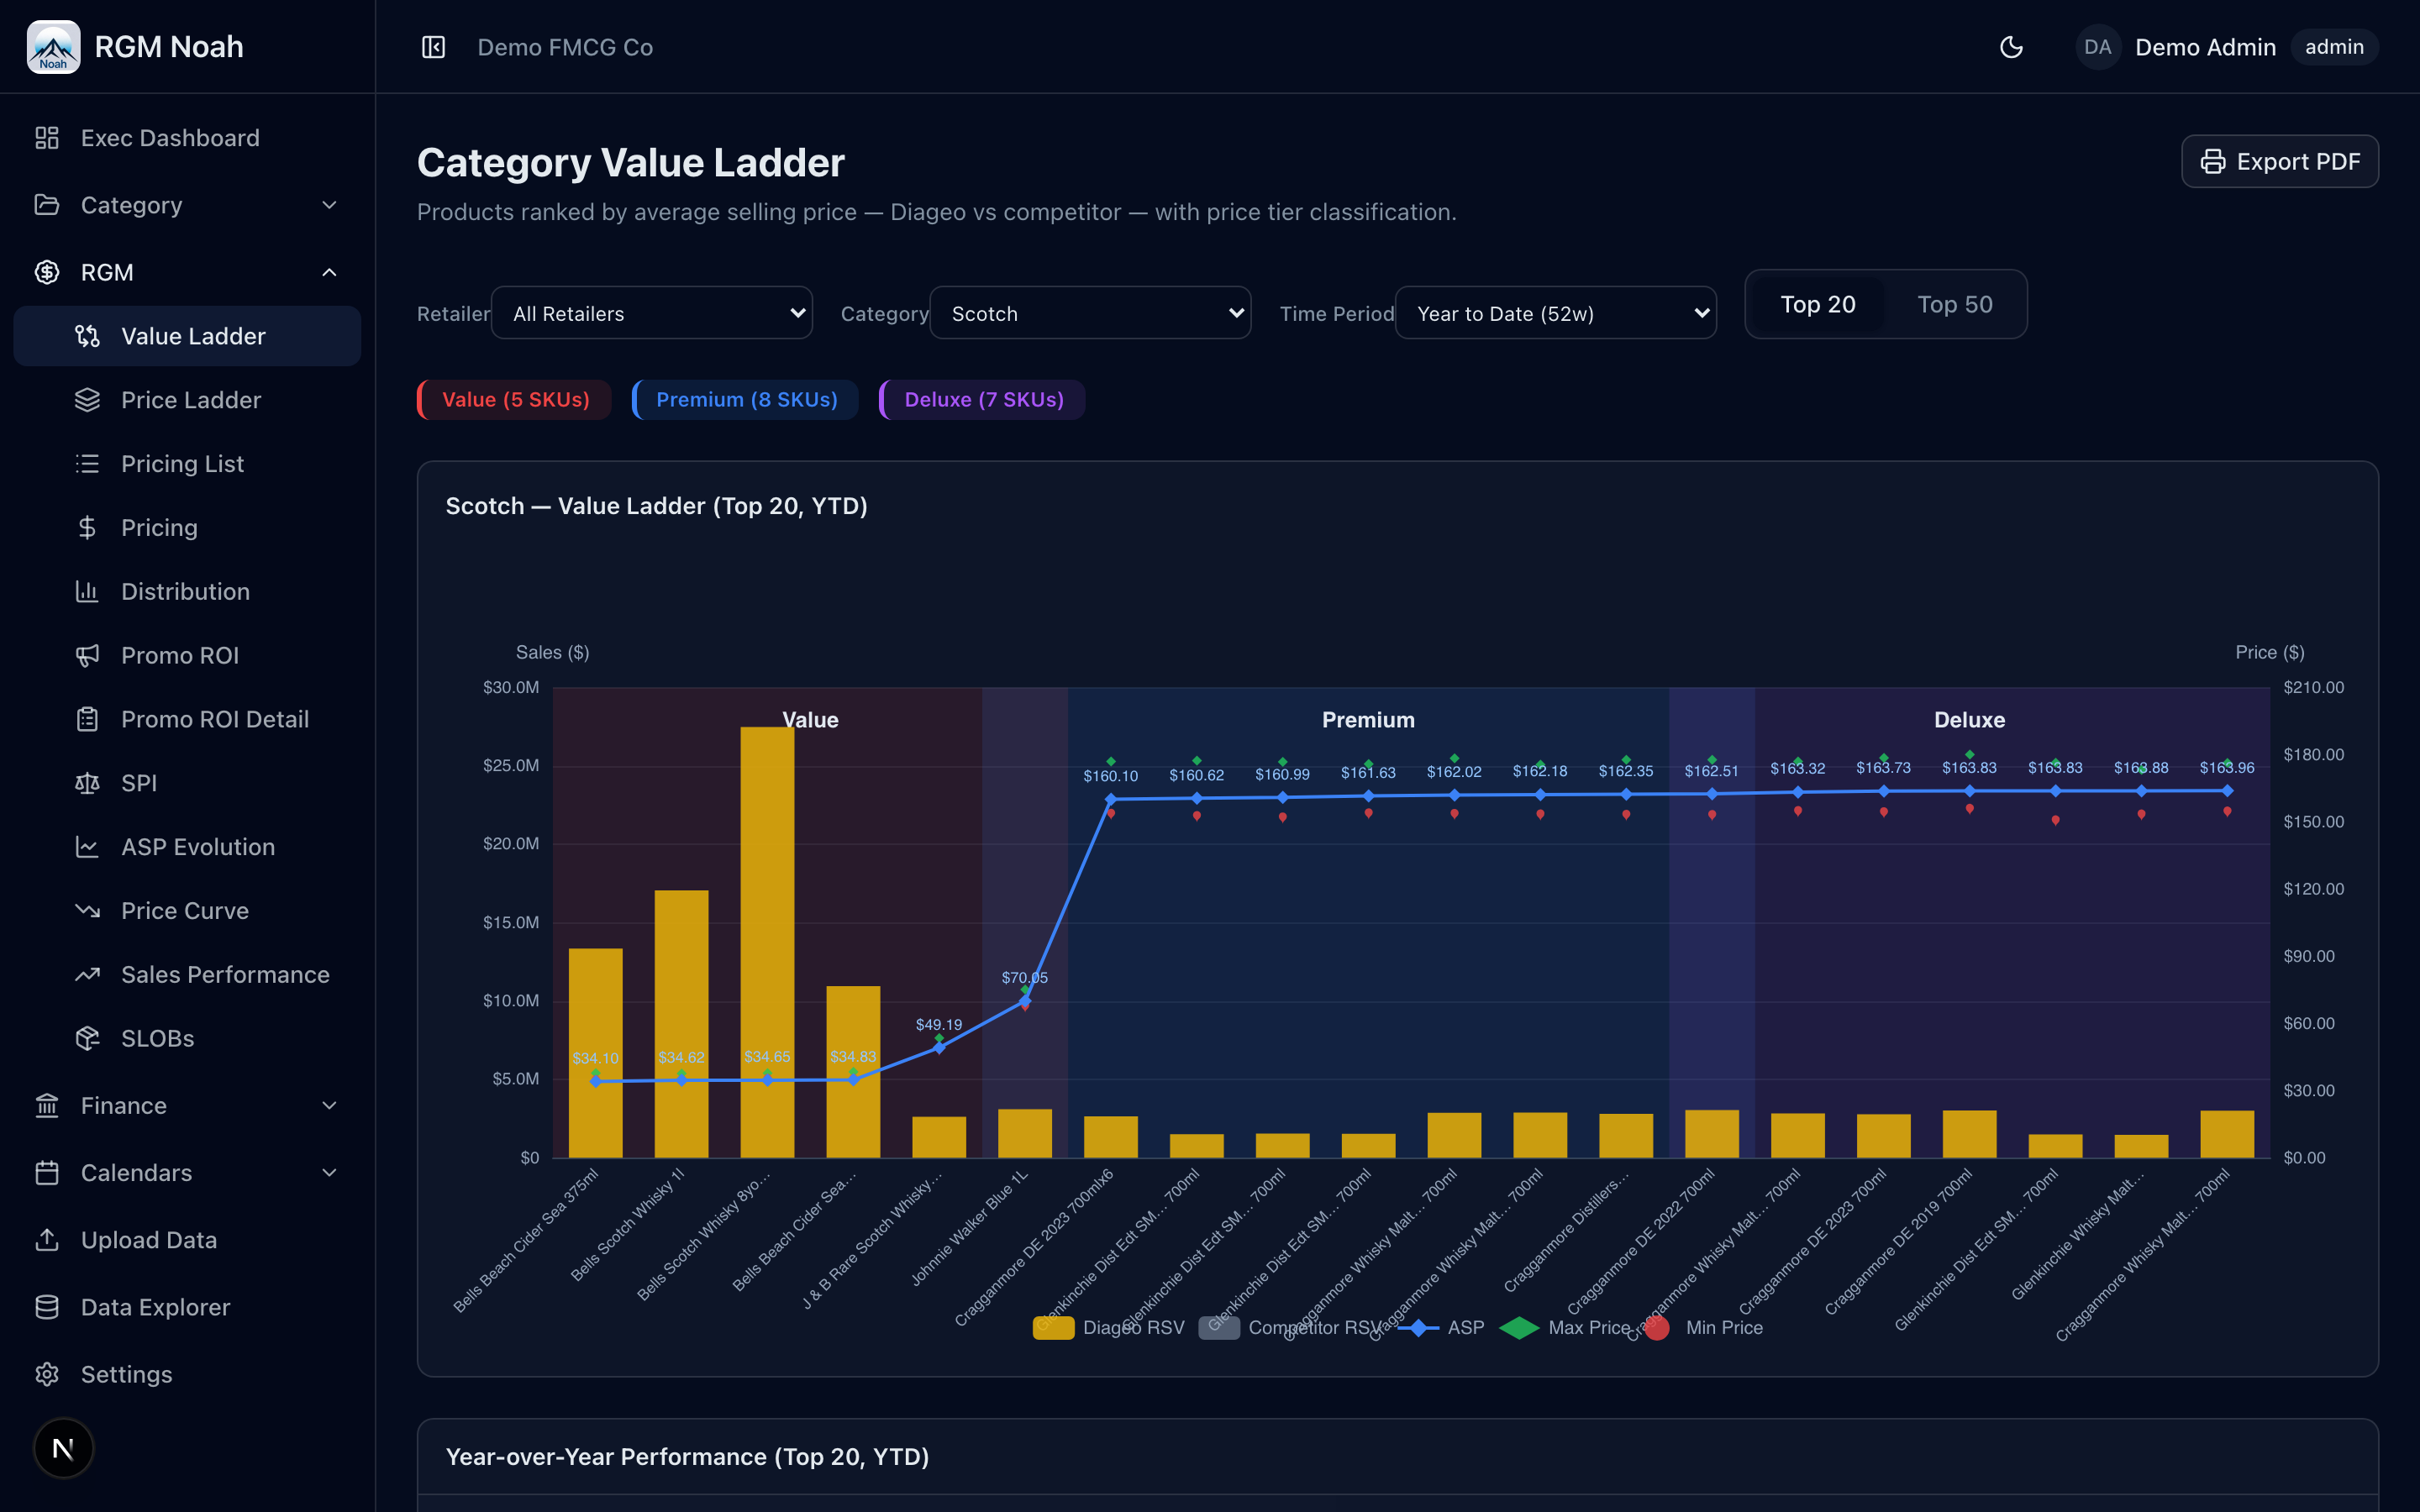
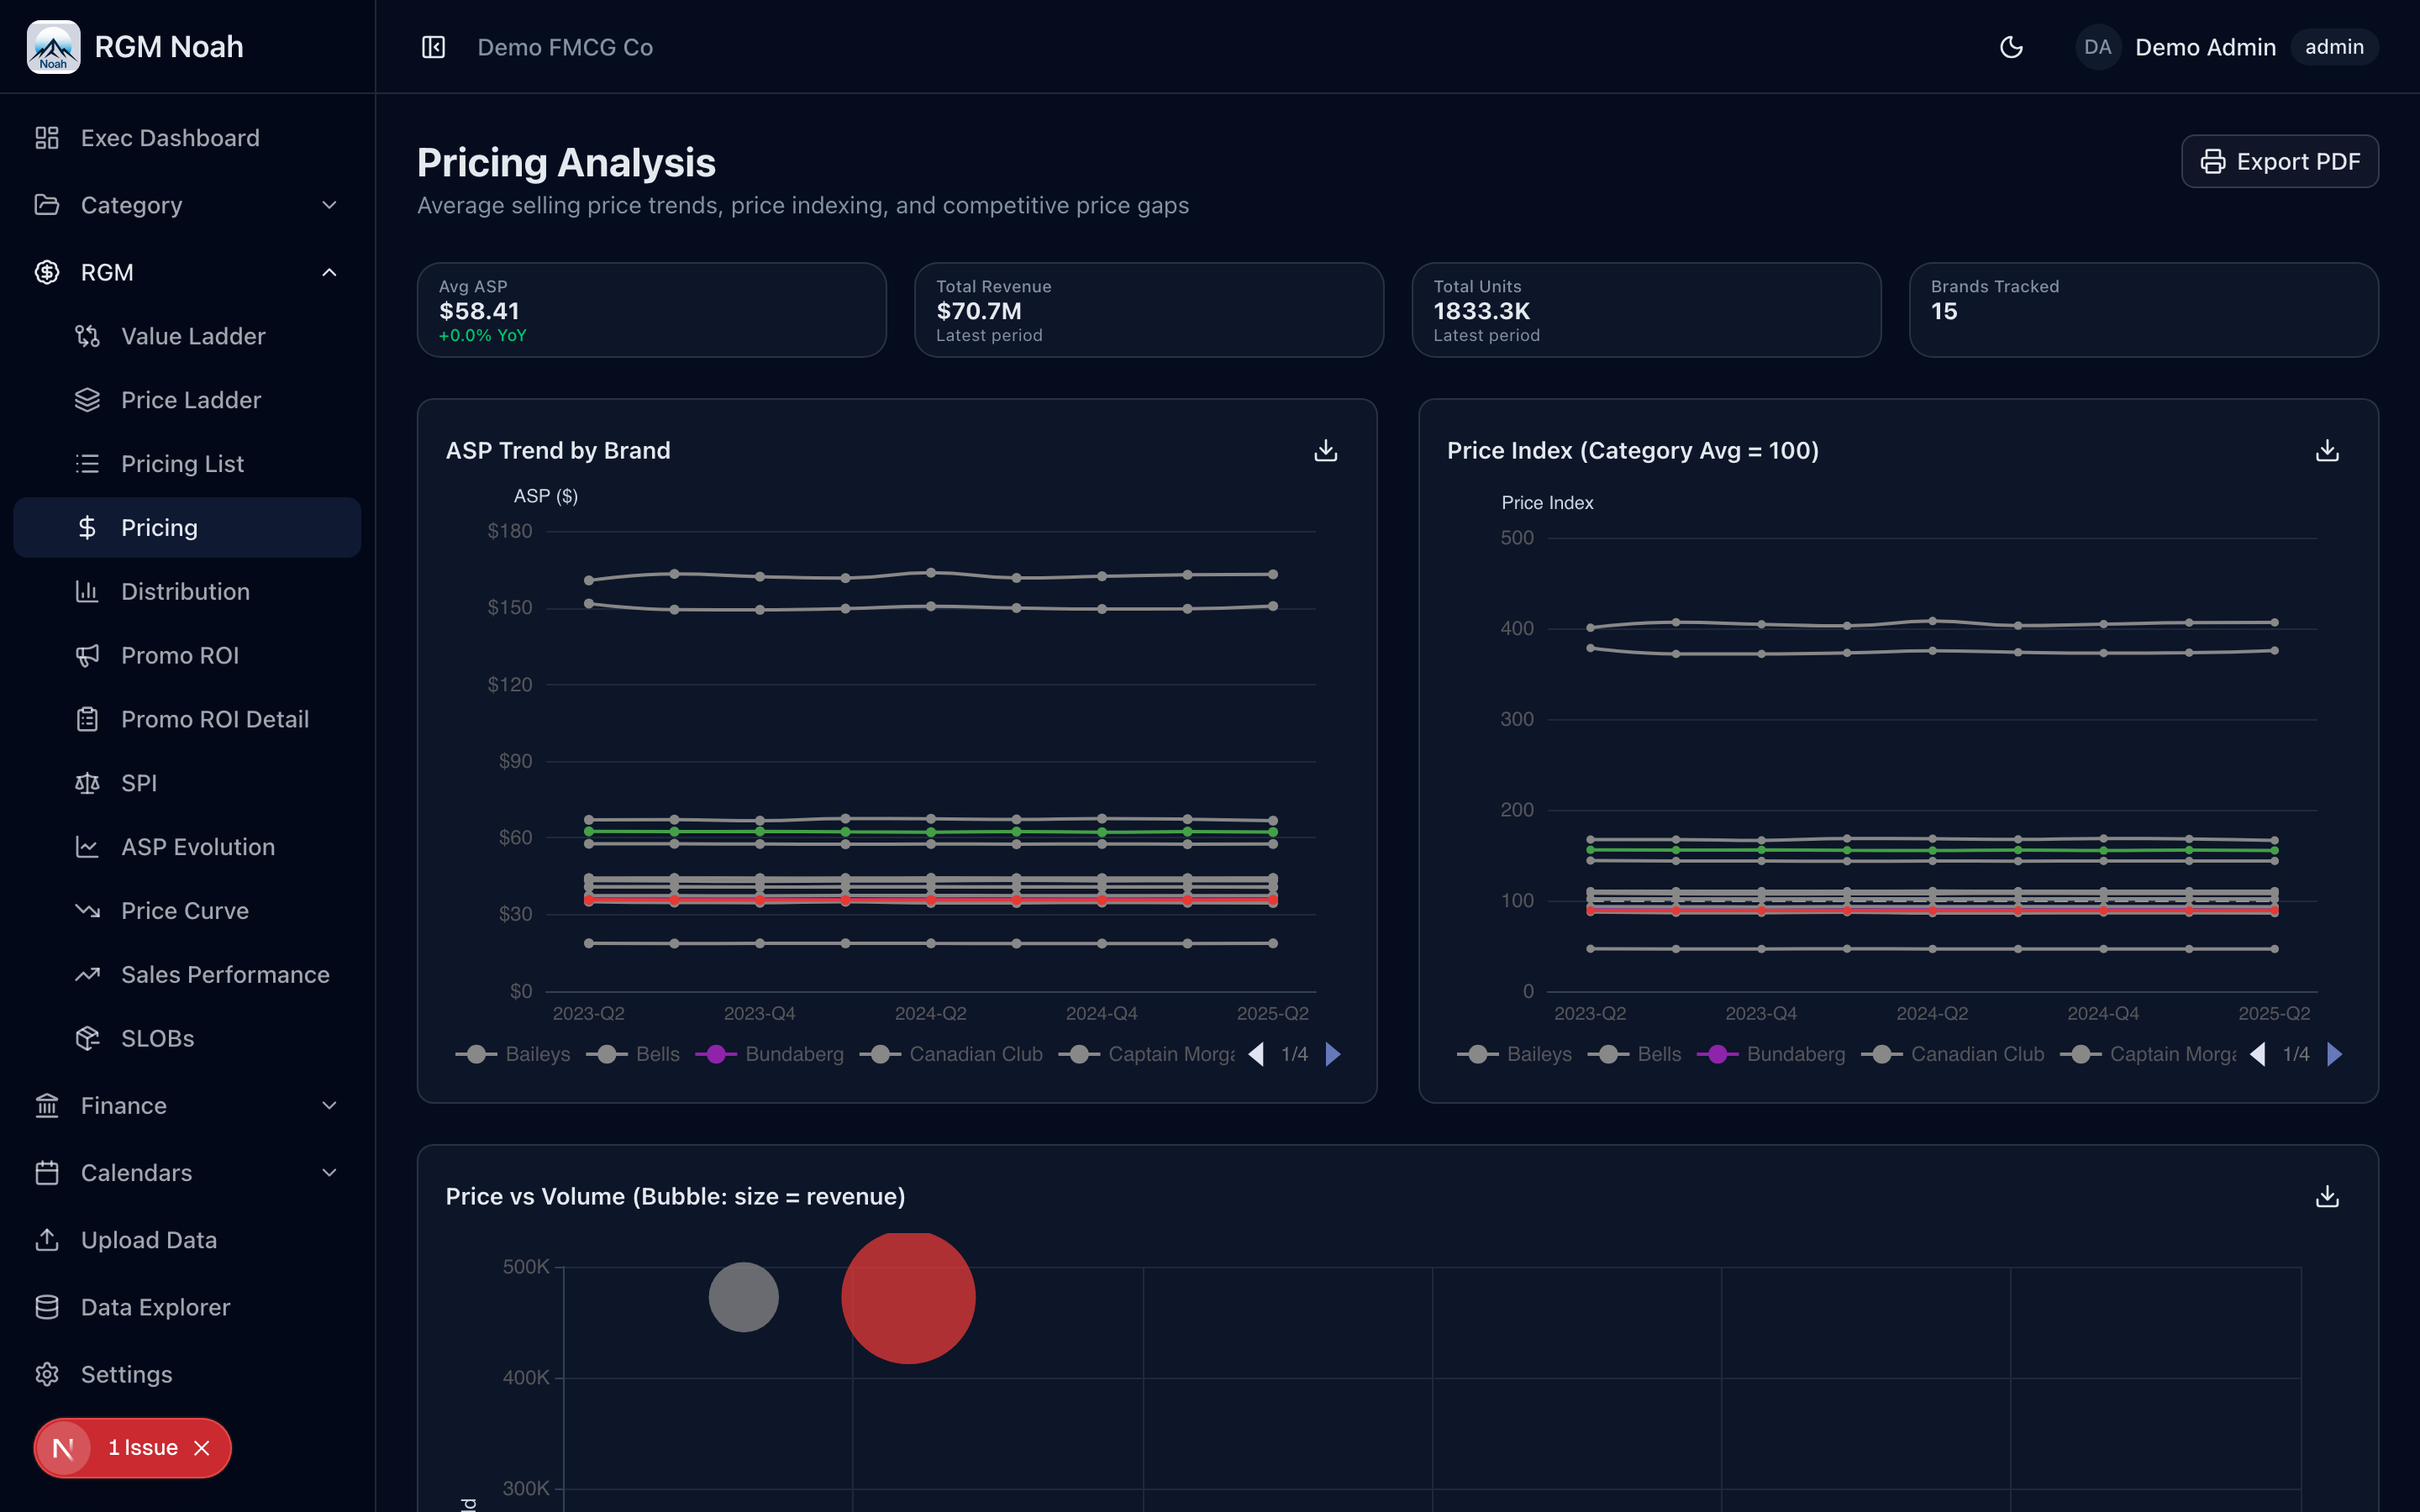
- Understand your price position vs competition at every tier
- Decompose gross profit changes so nothing is unexplained
Align your teams
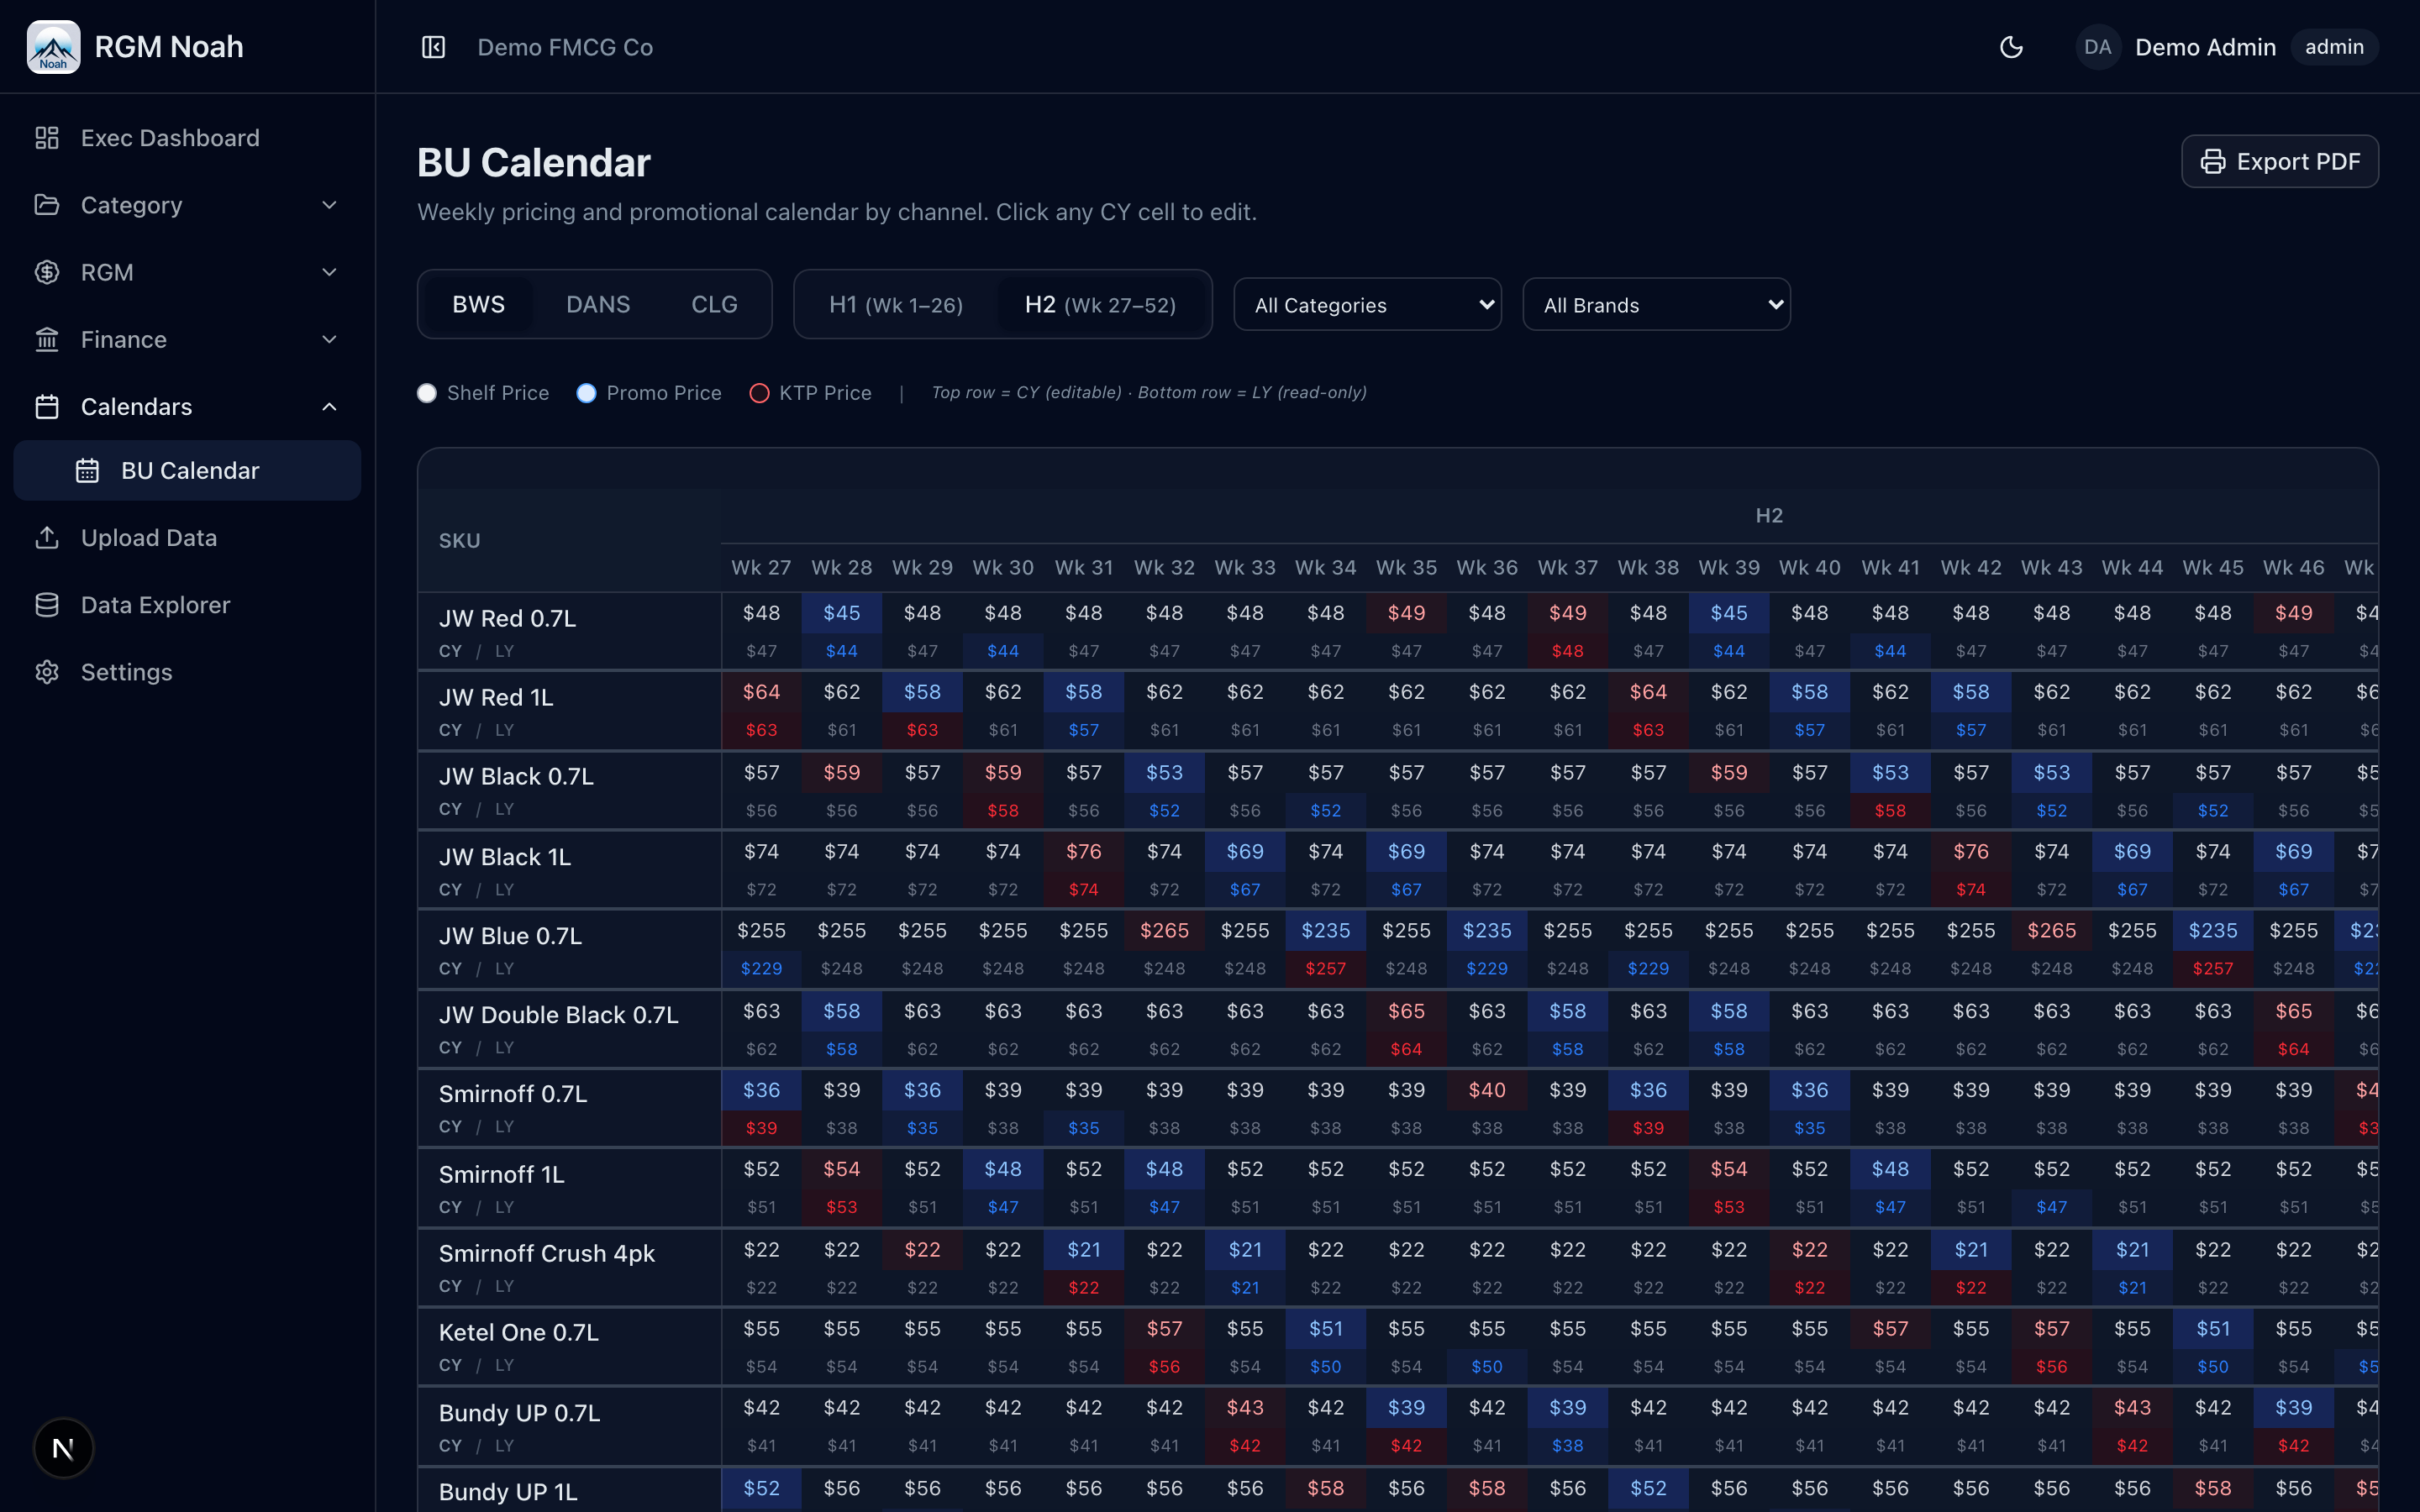
End the 'which calendar are we using?' conversation for good
When sales, finance, and RGM each maintain their own pricing calendars, misalignment is guaranteed. RGM Noah gives everyone a single, live calendar — with shelf, promo, and KTP pricing visible side-by-side with last year — so every team plans from the same numbers.
- One 52-week calendar that sales, finance, and RGM all trust
- Edit prices live — no more emailing spreadsheets back and forth
- P&L summaries and brand floor analysis built in, not bolted on
Everything in one place
Every analysis your team runs — already built
Why Noah
Built for how your team actually works
You don't have six months to configure a generic BI tool. RGM Noah is ready on day one — with the analyses your commercial team runs every week already built in.
Answers in seconds, not days
In-browser analytics engine means no tickets to IT, no server queues. Your team gets answers the moment they ask the question.
Your data stays yours
Per-tenant isolation, encryption at rest and in transit, role-based access, and audit trails. Built for the security standards your procurement team demands.
Configured to your business
Your categories, your KPIs, your data feeds. Every deployment is tailored — not a blank canvas you have to build yourself.
No more retrofitting dashboards
Every chart and workflow is designed for FMCG commercial teams. No more bending a generic tool to do what you actually need.
Tailored to you
We don't hand you a blank canvas. We hand you the finished product.
Every deployment is built around your portfolio, your data sources, and how your teams actually operate. Your categories, your KPI definitions, your brand hierarchy — configured before you log in for the first time.
See what your team could have tomorrow
Walk through the full platform — sales, pricing, trade spend, calendars, finance — loaded with sample data so you can see exactly how it works for your business.
No sign-up required. Instant access.